
Deliverability monitoring: thresholds and blueprint
Which signals a deliverability monitoring system watches continuously, which thresholds serve as orientation, and how an escalation and pause logic is built.
Deliverability is a running state, not a setup step
Most teams treat deliverability as a one-off task: set up SPF, DKIM and DMARC, wait out warmup, start the sequence. That is enough at the beginning. It is not enough permanently.
Deliverability is a state that changes daily. Providers adjust their filters, recipients mark messages as spam, a single sender slips onto a blocklist, a new template suddenly hits a filter. Anyone who reacts only when the reply rate collapses is reacting weeks too late. The damage to domain reputation has already happened by then, and recovery takes considerably longer than the outage.
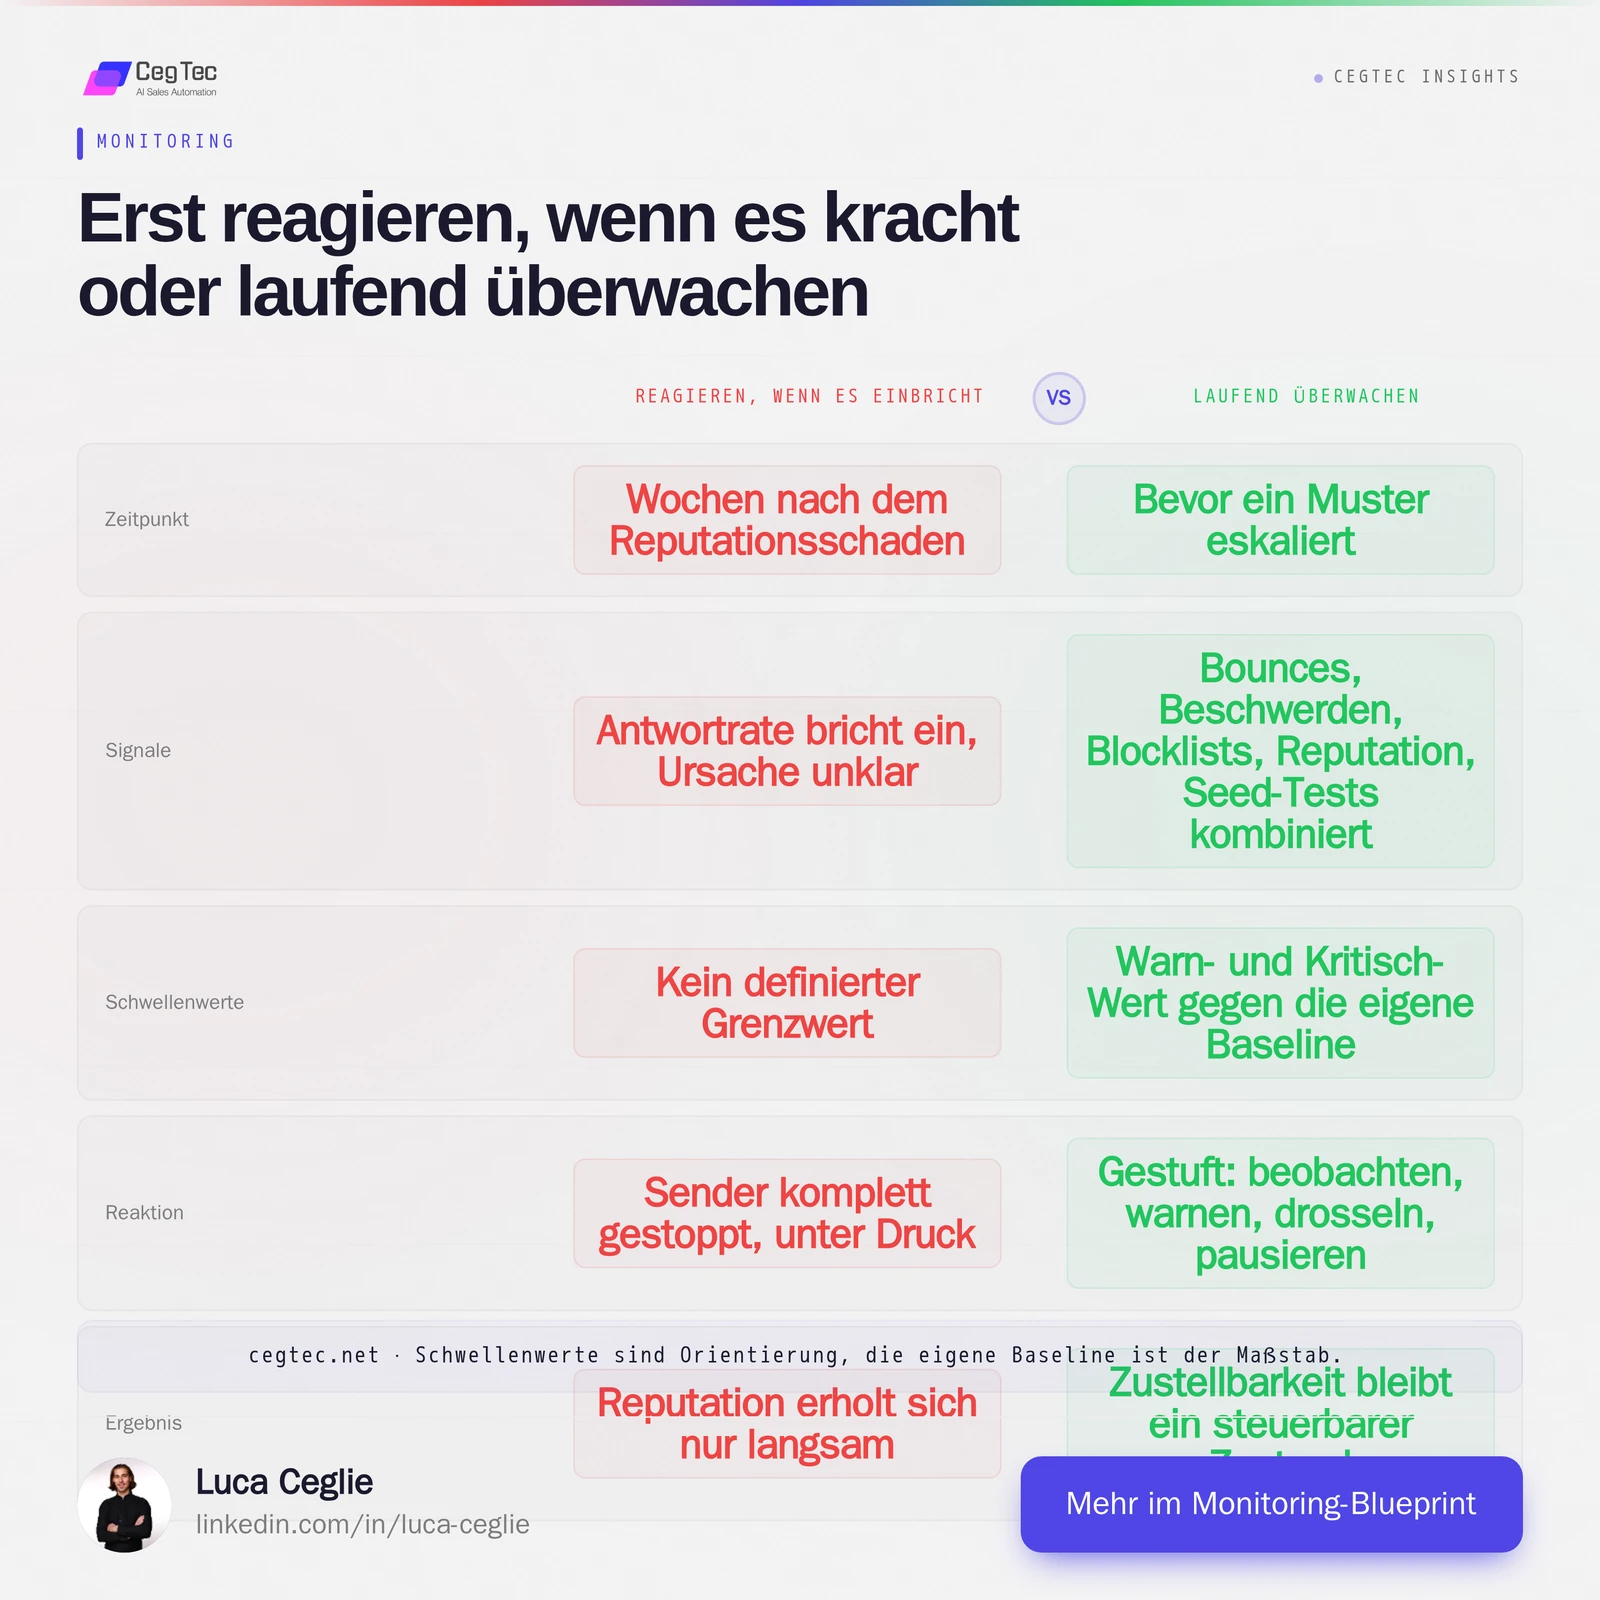
The difference is not the amount of effort but the timing. The left column reacts to damage that is already visible. The right one catches the pattern before it hits reputation. That shift forward is the entire purpose of monitoring.
A deliverability monitoring system inverts this logic. It observes the relevant signals continuously, compares them against defined thresholds and triggers actions before a problem escalates. This article describes the method behind it: which signals you monitor, which thresholds work as orientation, what an escalation and pause logic looks like, and how the whole thing fits together conceptually as a blueprint.
The signals you monitor continuously
No single signal describes deliverability completely. The picture only becomes meaningful when several indicators are brought together. These categories belong in any serious monitoring:
- Bounce rate: the share of undeliverable messages, separated into hard bounces (address does not exist) and soft bounces (temporary, e.g. full mailbox). Hard bounces are the more critical signal because they point directly to poor list quality.
- Spam complaint rate: how often recipients actively mark you as spam. Even low values have a disproportionate effect on reputation because providers weight complaints heavily.
- Open and reply anomalies: it is not the absolute value that counts but the break in trend. A sudden drop in open or reply rate without any change in content often indicates filtering or spam-folder placement.
- Blocklist status: whether your sending domains or IPs appear on known blocklists. An entry can affect individual providers or your entire sending volume.
- Domain and IP reputation: reputation scores assigned by mailbox providers and reputation services. They move more slowly than daily metrics and show structural trends.
- Seed tests (inbox placement): test sends to a set of controlled mailboxes across different providers. They show whether a message actually lands in the inbox, the promotions tab or the spam folder. Metrics alone say nothing about placement; seed tests close that gap.
The value comes from the combination. A slightly elevated bounce rate is uncritical on its own. Elevated bounces plus a falling reply rate plus a new blocklist entry is a clear alarm pattern.
Thresholds as orientation, not as law
The values below are common industry orientation figures, not numbers measured by CegTec and not guaranteed limits. The reliable reference point is always your own baseline over several weeks. When a current value deviates markedly from that baseline, the deviation usually matters more than hitting an absolute threshold.
- Hard bounce rate: as a rough corridor, a low single-digit percentage is considered tolerable; rising values in the mid single digits are widely treated as a warning signal for list quality and verification.
- Spam complaint rate: many orient themselves around fractions of a per cent here. Complaints weigh heavily, so tolerances are correspondingly tight compared with other metrics.
- Open and reply rate: no universal target value; read them relative to your own history. A double-digit percentage decline against baseline is a typical reason to look closer.
- Inbox placement from seed tests: the higher the share in the primary inbox, the better. If that share falls noticeably below the usual level, it is an early indicator — often before reply rates react.
- Reputation: interpret as a trend. A continuously falling curve is more relevant than a single low daily value.
Calibration is what matters: define a warning and a critical value per metric, document both, and review them regularly. A rigid threshold set that is never reviewed produces either alarm fatigue or blind spots.
Escalation and pause logic
A signal without a defined response is just noise. The core of a monitoring system is therefore the question: what happens when a threshold is exceeded? A tiered model has proven itself.
- Level 1, observe: a value approaches the warning band. The system logs and watches more closely but does not intervene. The aim is to spot patterns early without reacting to every fluctuation.
- Level 2, warn: the warning value is exceeded or several signals point downwards at once. The system notifies the responsible people with context: which metric, which sender, which campaign, which trend. Human review follows.
- Level 3, throttle: if the pattern intensifies, the affected sender’s volume is reduced rather than stopped outright. Throttling takes pressure off reputation without losing the channel entirely.
- Level 4, pause: at critical values — a fresh blocklist entry, sharply elevated complaints — the affected sender or campaign is paused automatically. That protects the remaining senders and overall reputation.
Two principles keep this model stable. First: isolate the problem as narrowly as possible. Pause a single sender rather than the whole pool when only that one is affected. Second: define clear restart conditions. A paused sender does not return arbitrarily but only once the triggering values have been back in the green over a defined period, ideally via a controlled re-warmup.
A conceptual blueprint
Independent of specific tools, deliverability monitoring can be thought of in four layers. This structure describes the method, not a particular product.
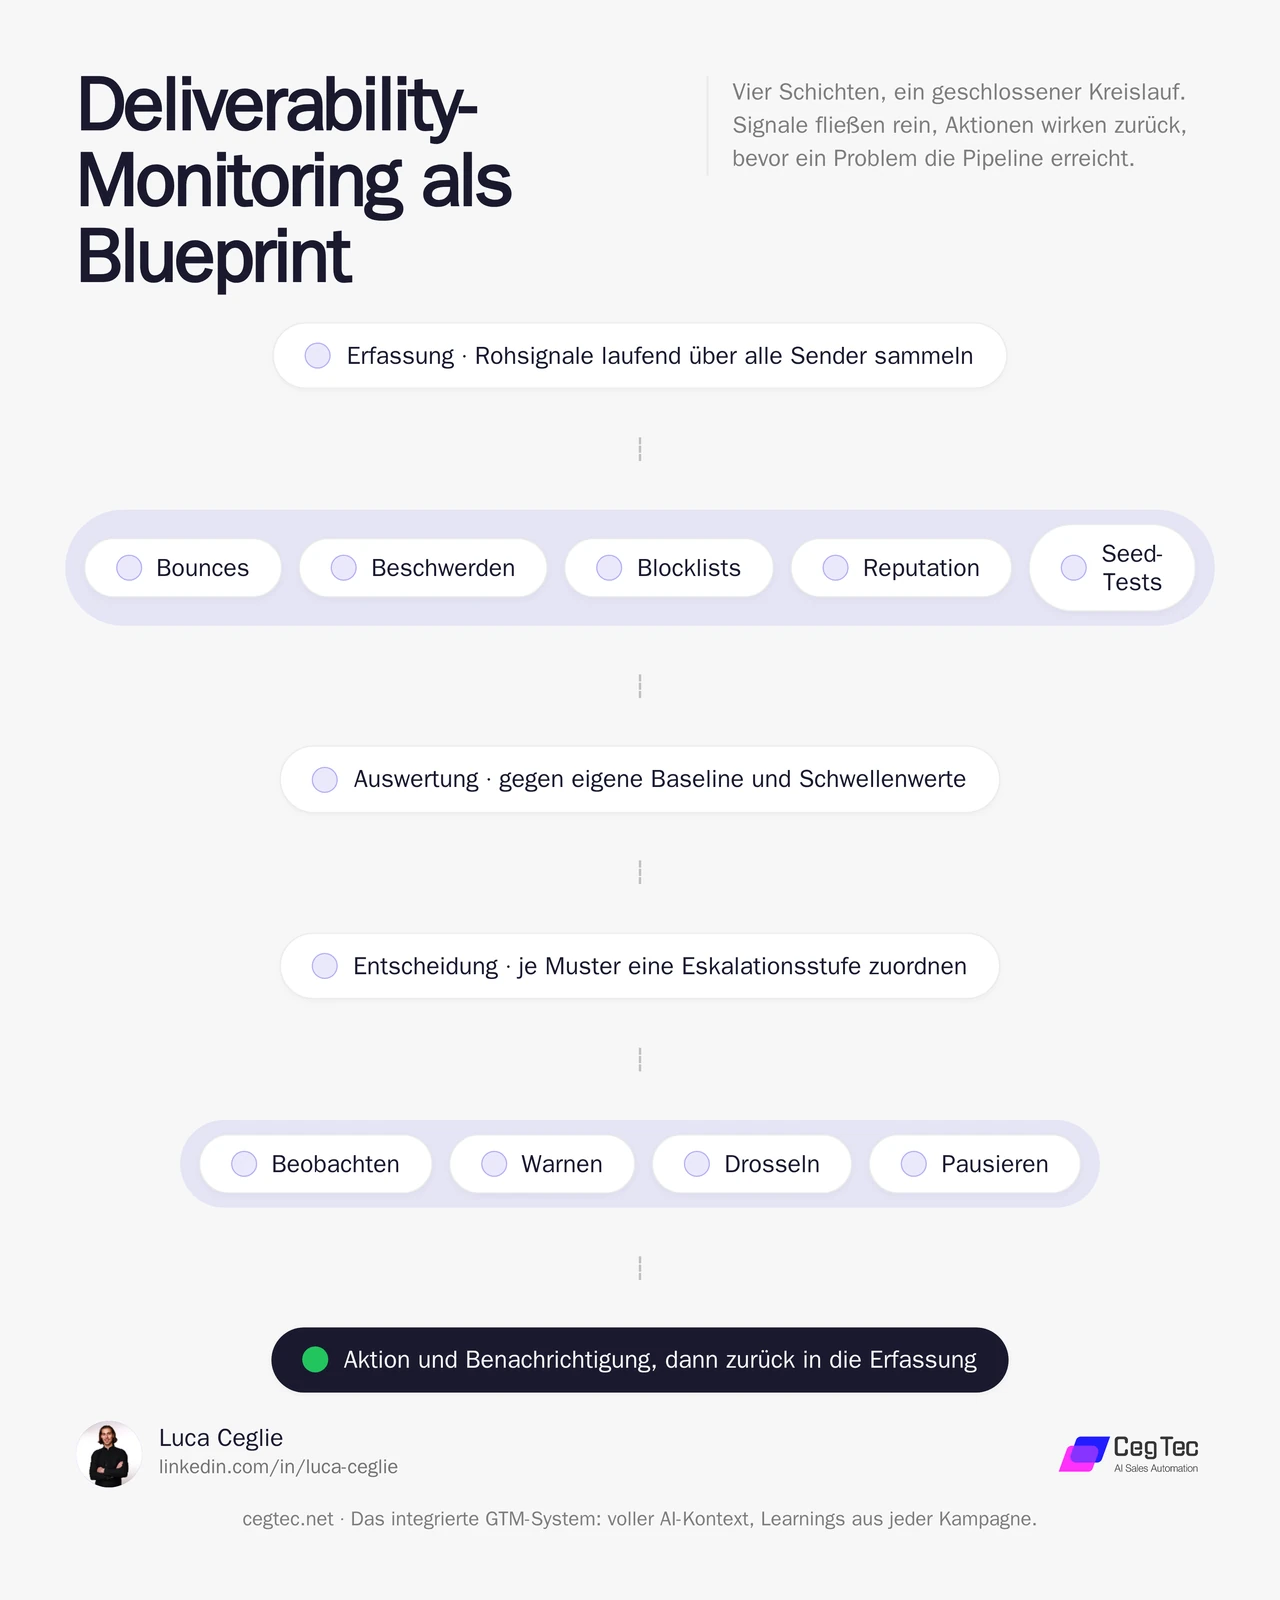
- Capture layer: continuously collects the raw signals from all relevant sources — sending platform, bounce and complaint feedback from providers, blocklist queries, reputation services and seed test results. Completeness across all senders matters.
- Evaluation layer: normalises the signals, forms the baseline per sender and campaign, and compares current values against baseline and thresholds. This is where raw data becomes an assessed picture including trend.
- Decision layer: applies the escalation and pause logic. It assigns a level to each detected pattern and decides between observe, warn, throttle and pause — always at the narrowest possible scope.
- Action and notification layer: executes the decision and informs the responsible people with enough context to intervene. Automatic protective measures and human approval interlock.
The decisive idea: the layers work in a closed loop. Actions change the signals, and the signals flow back into evaluation. That turns a static dashboard into a system that adjusts itself and catches problems before they reach the pipeline.
Two prompts for your monitoring
Two core steps of the blueprint can be captured as reusable prompts: calibrating the thresholds (evaluation layer) and classifying a triggered alarm (decision layer). Both are deliberately generic. Copy them, enter your own values, done.
1. Calibrate thresholds
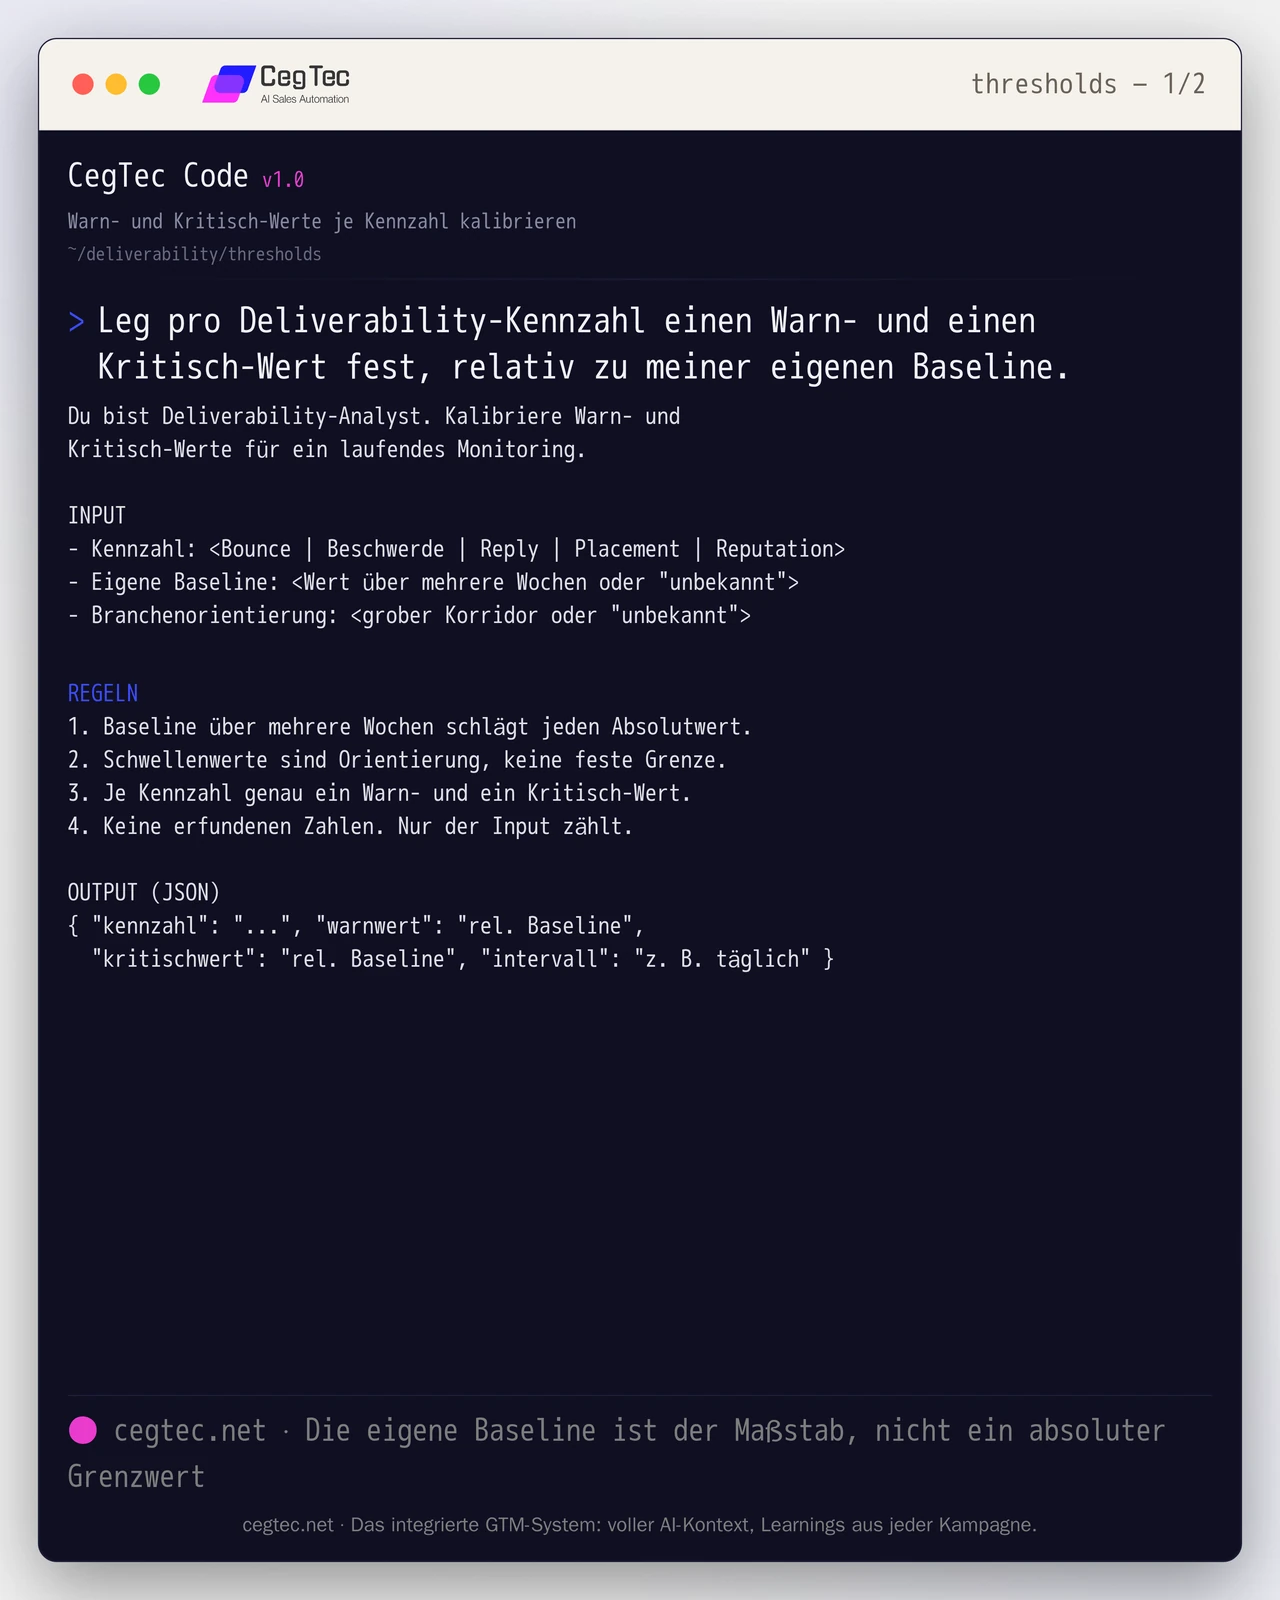
How to use it: state your own baseline over several weeks per metric plus a rough industry orientation. The prompt invents no numbers; it derives warning and critical values relative to your baseline. Repeat this for every metric and review the values regularly.
You are a deliverability analyst. Calibrate warning and
critical values for continuous monitoring.

INPUT
- Metric: <bounce | complaint | reply | placement | reputation>
- Own baseline: <value over several weeks or "unknown">
- Industry orientation: <rough corridor or "unknown">

RULES
1. A baseline over several weeks beats any absolute value.
2. Thresholds are orientation, not a fixed limit.
3. Exactly one warning and one critical value per metric.
4. No invented numbers. Only the input counts.

OUTPUT (JSON)
{ "metric": "...", "warning": "rel. baseline",
"critical": "rel. baseline", "interval": "e.g. daily" }2. Classify a triggered alarm
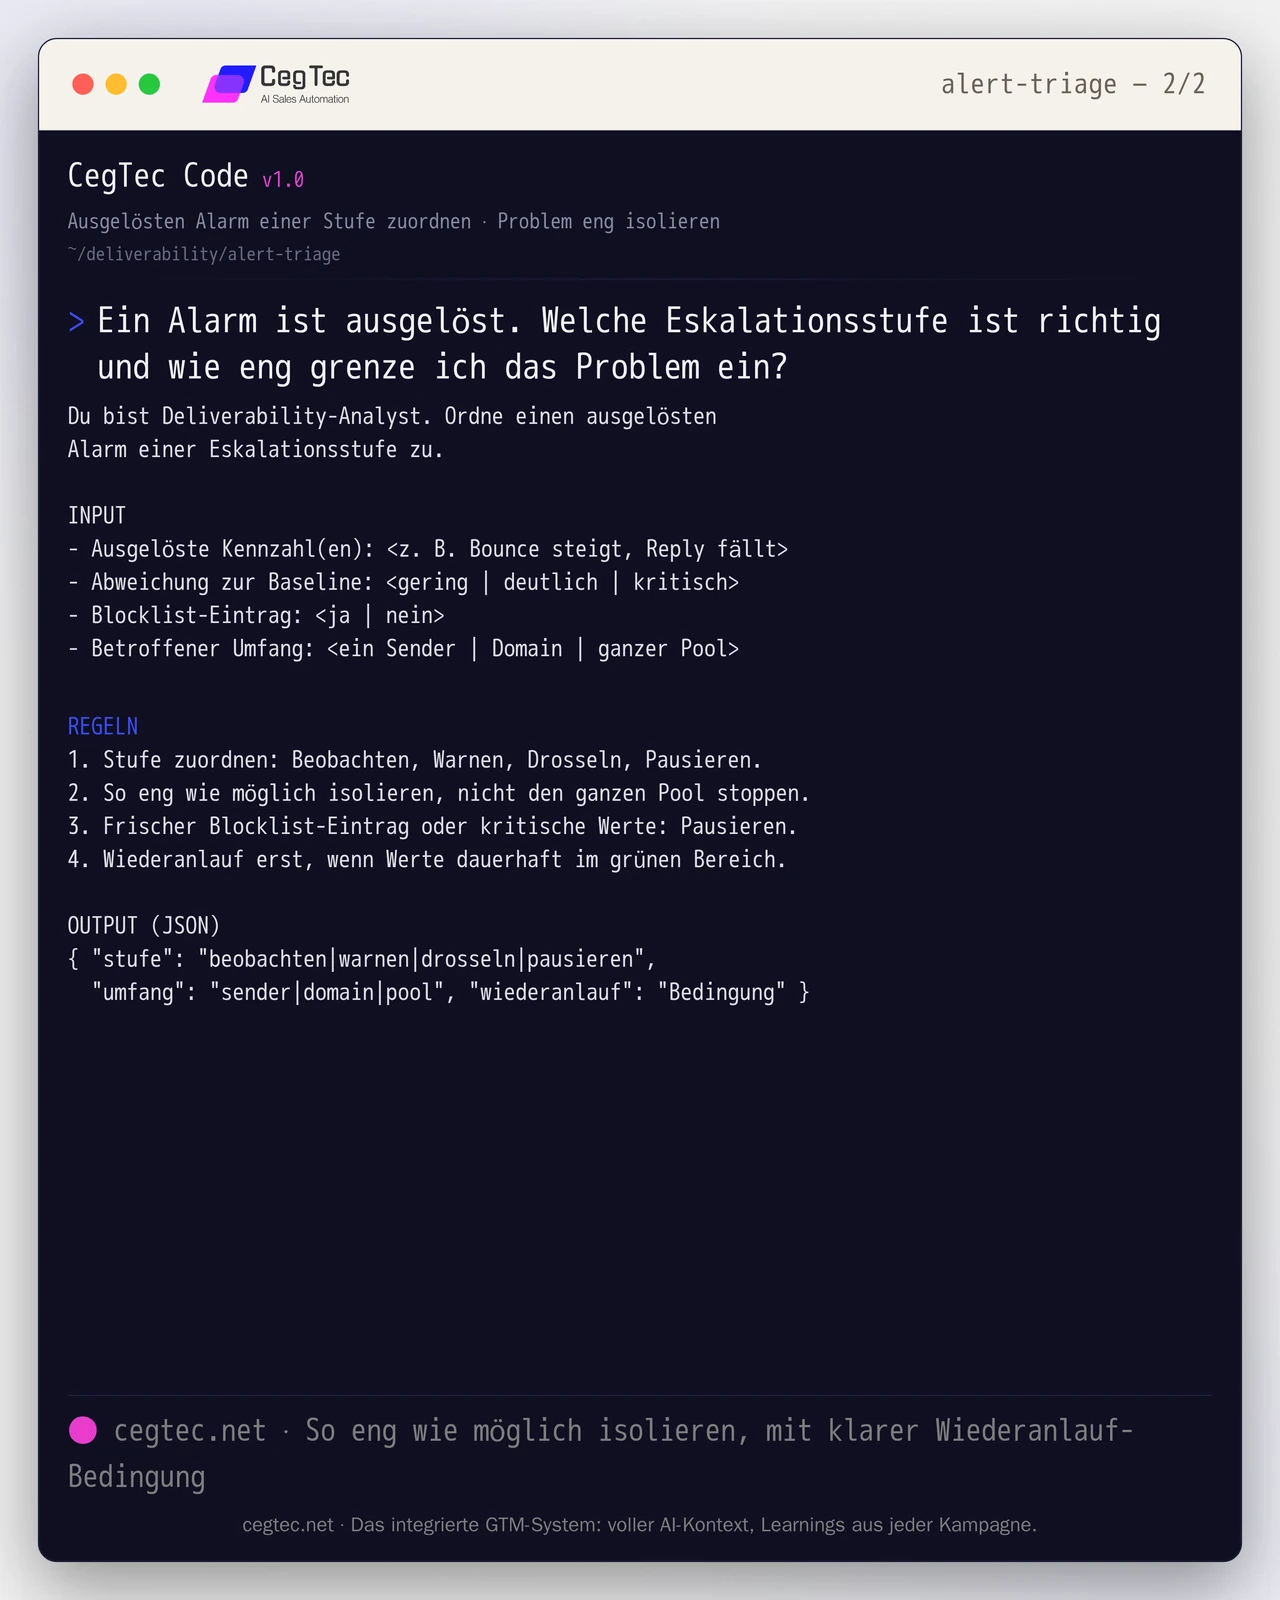
How to use it: enter which metrics moved, how large the deviation from baseline is, and how wide the affected scope is. The prompt assigns the case to one of the four levels, isolates as narrowly as possible and names the restart condition.
You are a deliverability analyst. Assign a triggered
alarm to an escalation level.

INPUT
- Triggered metric(s): <e.g. bounce rising, reply falling>
- Deviation from baseline: <slight | marked | critical>
- Blocklist entry: <yes | no>
- Affected scope: <one sender | domain | whole pool>

RULES
1. Assign a level: observe, warn, throttle, pause.
2. Isolate as narrowly as possible, do not stop the whole pool.
3. Fresh blocklist entry or critical values: pause.
4. Restart only once values are durably in the green.

OUTPUT (JSON)
{ "level": "observe|warn|throttle|pause",
"scope": "sender|domain|pool", "restart": "condition" }How to generate pipeline with this (in the GTM stack)
Pipeline does not come from a single tool but from several roles in the stack working together. With deliverability monitoring this is especially visible: it is the protective layer ensuring the sends that actually create pipeline arrive in the inbox and stay there. These roles interlock:
- Signal and data: which accounts get contacted at all, including trigger and priority, and which monitoring signals are captured continuously.
- Sending infrastructure and monitoring: the senders themselves plus the protective layer watching bounces, complaints, anomalies, blocklists, reputation and seed tests against your own baseline.
- Orchestration and decision: when to observe, warn, throttle or pause — always at the narrowest possible scope.
- Sending via email and LinkedIn: the channel on which the message is actually delivered.
- CRM: replies, status and history in one place.
What matters is less the individual tool than a layer connecting these roles into one process with one metric — here, the delivered, replyable email. A category-agnostic orchestration layer such as GTM Goat can translate monitoring signals into actions (throttle or pause) and address the remaining roles by category; you connect your sending infrastructure, your monitoring and your CRM instead of replacing them. Stack freely selectable, funnel singular.
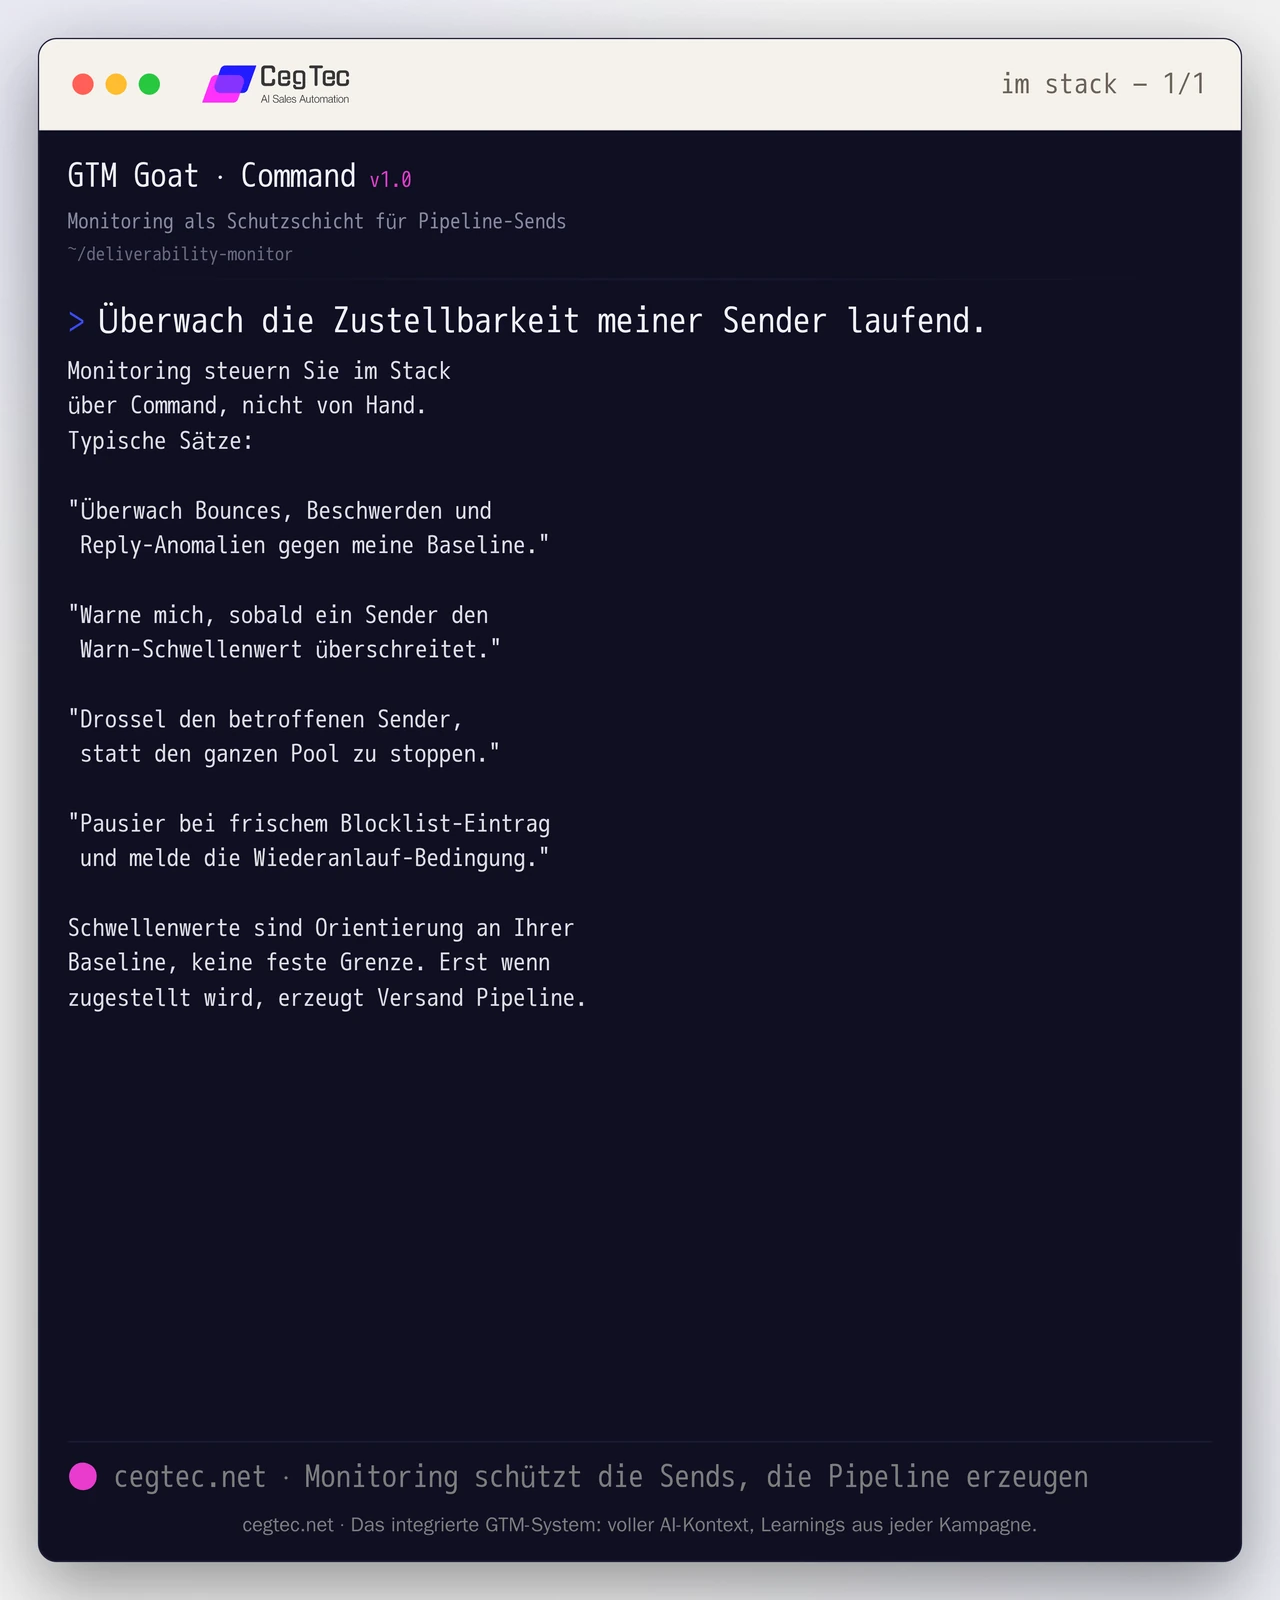
Here is how you run it in the stack: you steer monitoring through the Command interface, not by hand. The thresholds remain orientation against your own baseline, not a fixed limit. A few sentences, ready to type:
"Monitor bounces, complaints and reply anomalies against my baseline."
"Warn me as soon as a sender crosses the warning threshold."
"Throttle the affected sender instead of stopping the whole pool."
"Pause on a fresh blocklist entry and report the restart condition."The quickstart shows how to get started.
Conclusion
Deliverability decides whether your messages can be read at all, before content or timing play any role. Monitoring that continuously brings together bounces, complaints, anomalies, blocklists, reputation and seed tests, measures them against your own baseline and escalates in tiers turns deliverability from a silent hazard into a controllable state. The thresholds named here are orientation, not truth. Your own baseline is the yardstick.
If you would rather not build such a system yourself but run it as part of an automated GTM setup, take a look at GTM Goat or talk to us directly.
Next step
GTM Goat runs exactly what you just read.